Real-Time Performance Monitoring and Faster Debugging with NCCL Inspector and Prometheus
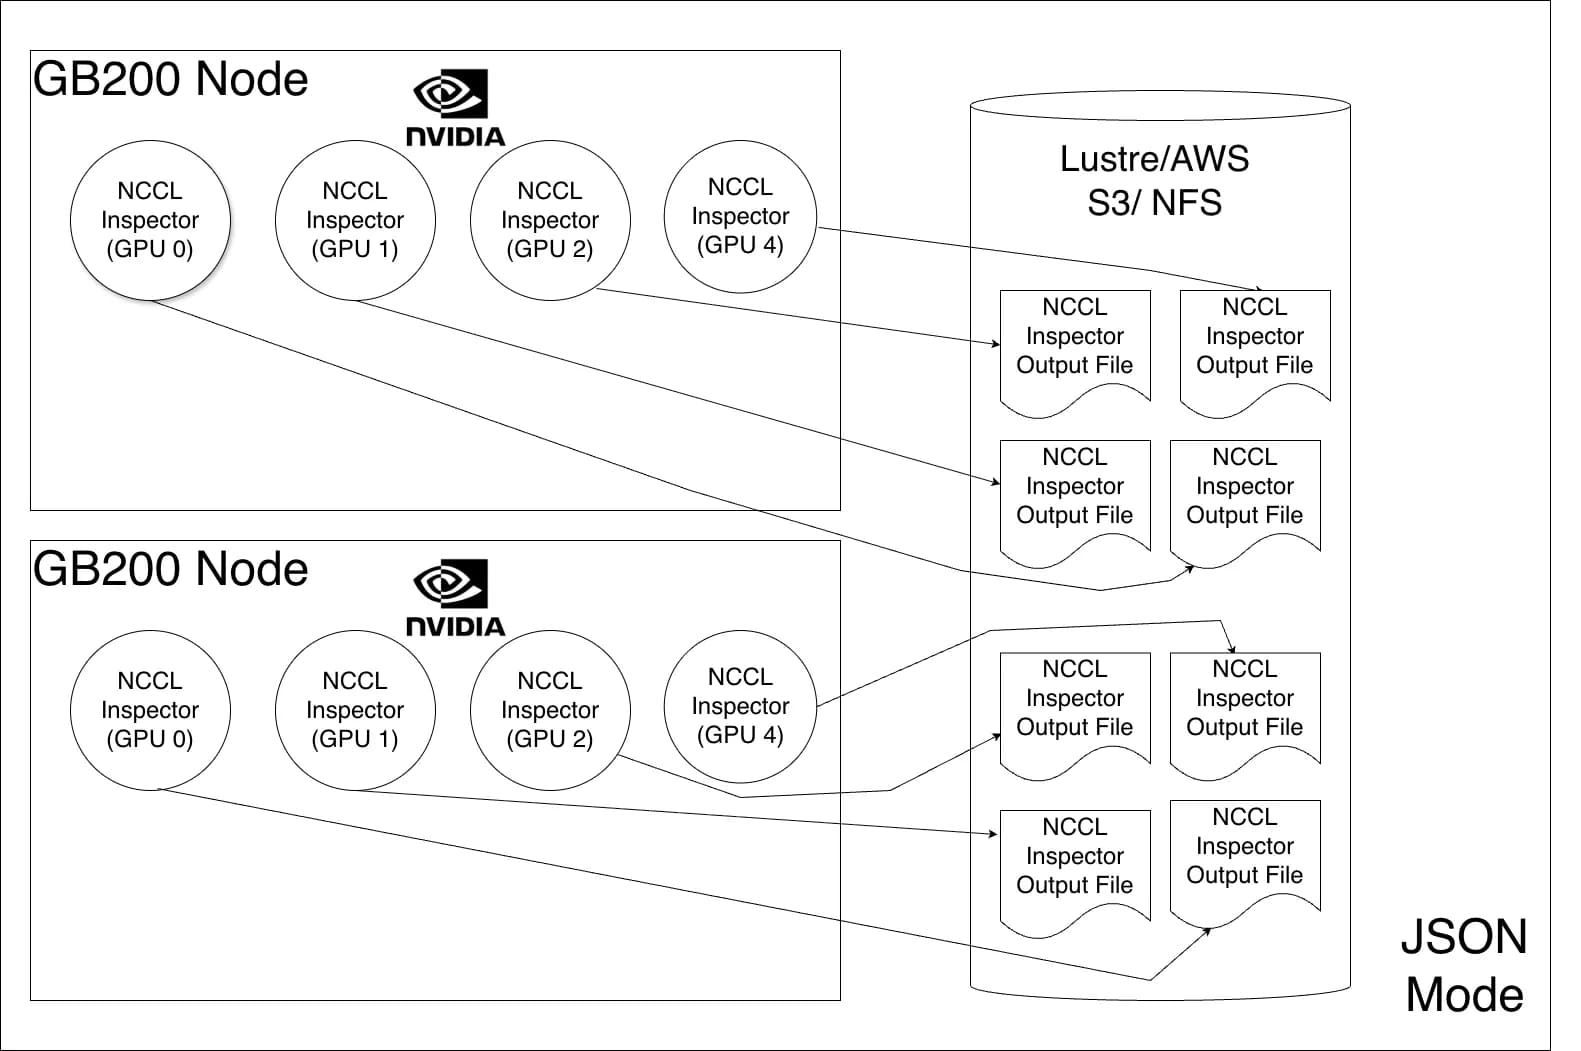
Distributed deep learning depends on fast, reliable GPU-to-GPU communication using the NVIDIA Collective Communication Library (NCCL). When training slows down, it becomes challenging to determine why and what to do next. A problem can span computation, communication, a specific rank, or underlying hardware. NVIDIA NCCL Inspector accelerates triaging by providing a lightweight and continuous report of NCCL communication performance. It tracks operation type, size, and bandwidth across every rank, and with this latest enhancement, can facilitate real-time analysis with minimal overhead. It also helps determine the optimal training recipe. A previous post introduced NCCL Inspector offline mode. While fine-grained analysis remains the standard for deep-dive data, this post introduces real-time monitoring, a new feature. Live, time-series visualizations can now be powered directly within a user’s infrastructure dashboard by integrating NCCL Inspector with Prometheus Exporter. NCCL Inspector deployment architecture NCCL 2.30 introduces Prometheus Mode, a major enhancement for real-time performance monitoring of NCCL in AI workloads. The NCCL Inspector works in two modes, shown in Figures 1 and 2. The JSON mode operates in a data collection and data analysis phase. First, the data collection phase generates performance metrics from each rank and stores them individually in a JSON file, typically on shared storage. Then, the data analysis phase processes the data. This method is considered offline since the processing isn’t completed in real time. This new feature integrates NCCL Inspector metrics with Prometheus, converting them into time-series data suitable for visualization in Grafana dashboards. Prometheus mode eliminates the large storage requirements previously necessary for JSON mode. This metric data is moved by the node exporter to Prometheus—a scalable, cloud-native platform. The NCCL job output file is designed to be overwritten continuously. Once the node exporter collects the metrics, they’re no longer needed on disk. Experimental setup for Prometheus Mode Setting up the NCCL Inspector Profiler plugin requires building the plugin and setting the following required environment variables: NCCL_PROFILER_PLUGIN=/path/to/nccl/plugins/profiler/inspector/libnccl-profiler-inspector.so NCCL_INSPECTOR_ENABLE=1 NCCL_INSPECTOR_DUMP_THREAD_INTERVAL_MICROSECONDS=3000000 NCCL_INSPECTOR_PROM_DUMP=1 NCCL_INSPECTOR_DUMP_DIR=/path/to/node/exporter/log/location The dump thread interval and dump directory should be set and tuned according to the node exporter used. Once configured, NCCL Inspector starts the process and dumps collective performance into the NCCL_INSPECTOR_DUMP_DIR. The Prometheus Node Exporter then sends the metrics to the Prometheus time-series database. Finally, these time-series metrics are rendered as dashboard graphs with Graphana. When running the job, the metrics are saved to a file with the format: nccl_inspector_metrics_<uuid_of_the_gpu>.prom The UUID of the GPU is included in the file name since CUDA device IDs can overlap in a multi-user environment. The NCCL job output file is in the Prometheus exposition format. Each metric is labeled with context, including NCCL version, Slurm job ID, node, GPU, communicator name, number of nodes, number of ranks, and message size. The following is an example: nccl_p2p_bus_bandwidth_gbs{version="v5.1",slurm_job_id="1670760",node="nvl72033-T01",gpu="GPU0",comm_name="unknown",n_nodes="1",nranks="64",p2p_operation="Send",message_size="1-2MB"} 19.1634 nccl_p2p_exec_time_microseconds{version="v5.1",slurm_job_id="1670760",node="nvl72033-T01",gpu="GPU0",comm_name="unknown",n_nodes="1",nranks="64",p2p_operation="Send",message_size="1-2MB"} 92.8984 nccl_p2p_bus_bandwidth_gbs{version="v5.1",slurm_job_id="1670760",node="nvl72033-T01",gpu="GPU0",comm_name="unknown",n_nodes="1",nranks="64",p2p_operation="Recv",message_size="1-2MB"} 19.2396 nccl_p2p_exec_time_microseconds{version="v5.1",slurm_job_id="1670760",node="nvl72033-T01",gpu="GPU0",comm_name="unknown",n_nodes="1",nranks="64",p2p_operation="Recv",message_size="1-2MB"} 92.5781 nccl_bus_bandwidth_gbs{version="v5.1",slurm_job_id="1670760",node="nvl72033-T01",gpu="GPU0",comm_name="unknown",n_nodes="4",nranks="32",collective="ReduceScatter",message_size="134-135MB",algo_proto="RING_SIMPLE"} 44.1181 nccl_collective_exec_time_microseconds{version="v5.1",slurm_job_id="1670760",node="nvl72033-T01",gpu="GPU0",comm_name="unknown",n_nodes="4",nranks="32",collective="ReduceScatter",message_size="134-135MB",algo_proto="RING_SIMPLE"} 104164 Once these metrics land in a Prometheus DB, the next step is rendering them in Grafana. Time series-based Grafana dashboards Figure 3 shows an example of how time series dashboards look using the…